
A trackable QR code is one of the most cost-effective marketing tools available to a business in 2026. It bridges the gap between a physical object and a measurable digital action, giving you first-party data on who engaged, where, when, and on what device – without cookies, without app downloads, and without any friction for the person scanning.
Most businesses using QR codes are only scratching the surface of what the analytics can tell them. They look at total scan counts and move on. The businesses pulling ahead are using scan data to validate offline spend, optimize QR campaign placements, A/B test destinations, and prove ROI to stakeholders.
This guide covers everything: how trackable QR codes work technically, which metrics matter, how to connect scan data to Google Analytics 4 via UTM parameters, industry benchmarks for 2026, and how to act on the data once you have it.
- Businesses that actively track and optimise QR campaigns report a 37% average CTR on QR-initiated journeys, vs 2 to 5% for display advertising (QR Insights, 2026).
- Only dynamic QR codes are trackable. Static codes have zero analytics capability.
- Core metrics to track: total scans, unique scans, location, device type, and time of scan.
- Connecting scan data to Google Analytics 4 via UTM parameters reveals post-scan behavior: bounce rate, session duration, and conversions.
- 87% of marketers say understanding the customer journey post-scan is their top challenge in proving QR ROI (Bitly, 2026). UTM parameters solve this.
- The most valuable metric for 54% of marketers is unique scans, followed by conversion rate post-scan at 52% (Bitly, 2026).
- OpenQR provides real-time analytics on every dynamic QR code from the first scan. Free 14-day trial, no card needed.
- How Trackable QR Codes Work
- Static vs Dynamic: Why Only One Can Be Tracked
- The 6 Core Metrics to Track
- Connecting QR Codes to Google Analytics 4 with UTM Parameters
- Reading Your OpenQR Analytics Dashboard
- A/B Testing QR Codes to Improve Performance
- QR Code Performance Benchmarks for 2026
- Real-World Use Cases: What Good Analytics Look Like
- How to Improve Scan Rates Using Your Data
- Frequently Asked Questions
1. How Trackable QR Codes Work
A trackable QR code does not encode your destination URL directly into the pattern. Instead, it encodes a short redirect URL hosted on your QR code provider’s server. Here is what happens in the milliseconds between a scan and the destination loading:
- The person scans the code with their phone camera
- The phone decodes the short redirect URL from the pattern
- The device sends an HTTP request to the provider’s redirect server
- The server logs the scan: timestamp, approximate location (from IP), device type, operating system, and browser
- The server instantly redirects the user to your destination URL
- The user arrives at your page, typically within 300 milliseconds
That brief, invisible redirect at step 4 is where all the analytics happen. The user never notices it, but your dashboard captures the data immediately.
QR codes generate first-party signals like time, location, and repeat behavior without relying on cookies, apps, or logins. That makes them especially useful as third-party tracking becomes more constrained in 2026. When you connect scans to analytics, you gain clearer visibility into what physical touchpoints drive digital engagement – without the privacy concerns that come with cookie-based tracking (Bitly, 2026).
The redirect architecture also gives you the ability to change the destination at any time. Because the printed code only ever points to the redirect URL, you can update where it sends people from your dashboard without touching the physical code. This is the editable nature of dynamic QR codes, and it is what makes them practical for printed materials with a long lifespan.
2. Static vs Dynamic: Why Only One Can Be Tracked
The most common mistake businesses make with QR codes is creating a static code for a use case that requires tracking or updating. The distinction matters so much that it is worth being explicit about it here.
| Feature | Static QR Code | Dynamic (Trackable) QR Code |
|---|---|---|
| Destination URL | Fixed permanently at creation | Editable any time from dashboard |
| Scan analytics | None | Full: location, device, time, total, unique |
| Update after printing | Not possible | Yes, instantly, no reprint needed |
| A/B testing destinations | Not possible | Yes |
| UTM parameter support | Fixed at creation only | Update UTM destination anytime |
| Code expires | No (URL must stay live) | Never expires with OpenQR |
| Right choice for business | ❌ | ✅ Always |
Dynamic QR codes held 65% of QR code market share in 2024 and are projected to grow at 19.2% CAGR through 2030 (Mordor Intelligence). The shift is not about features – it is about how teams now use QR codes. Early adoption focused on scan counts. By 2026, analytics expectations are much higher. Teams want to understand not just how many scans happen, but where, when, and what those scans lead to (QR Code KIT, January 2026).
For a full breakdown of the differences, see our static vs dynamic QR code comparison.
3. The 6 Core Metrics to Track
Not all QR analytics data is equally useful. These six metrics drive actionable decisions.
Total Scans
The raw count of every scan event. Your baseline reach metric. Use it to measure overall visibility and compare performance across time periods and campaigns. A high number on its own says little – always read it alongside unique scans.
Scan Location
Geographic breakdown by country, region, and city. This tells you where your audience actually is – not where you assumed they were. For outdoor campaigns, location data validates whether your placements are reaching the intended geography. For e-commerce brands, unexpected scan clusters from a new city often signal an untapped market worth targeting.
Device and OS
iOS vs Android split, plus browser type. If 80% of your scans come from iOS users, optimise your destination for Safari. Device data also serves as a useful audience proxy – iOS tends to index toward younger and higher-income demographics in Western markets.
Time of Scan
Hourly and daily distribution. This tells you your peak engagement windows. For restaurants, update menus before the dinner peak. For retail, know which days drive most in-store scanning. For events, watch the live scan activity to understand attendee flow in real time.
Scan Trend
Performance over time – growing, flat, or declining. A declining trend usually means the code has become physically invisible (worn off, covered) or the surrounding context has lost novelty. Use trend data to decide when to refresh placements or update the linked content to something more current.
Standard QR analytics shows everything about the scan itself. It does not show what users do after they land on your page – how long they stayed, what they clicked, or whether they converted. For post-scan behavior you need Google Analytics 4 integration via UTM parameters, covered in the next section.
4. Connecting QR Codes to Google Analytics 4 with UTM Parameters
This is the section most QR code guides skip entirely, and it is where the biggest measurement gap exists. 87% of marketers say understanding the customer journey post-scan is their top challenge in demonstrating QR ROI (Bitly, 2026). UTM parameters are the solution.
A UTM parameter is a short tag appended to your destination URL that tells Google Analytics 4 exactly where a visitor came from. When you add UTMs to your QR code destination, every scan becomes a trackable session in GA4, with full post-scan behavior: bounce rate, pages viewed, session duration, and goal completions.
Recommended UTM structure for QR codes
| Parameter | Purpose | Example values |
|---|---|---|
utm_source | Where the code is physically placed | table_tent, packaging, window_sticker |
utm_medium | Always the same across all QR codes | qr_code |
utm_campaign | The campaign or initiative | summer_menu_2026, product_launch |
utm_content | Specific variant for A/B tests | logo_v1, no_logo_v2 |
Example UTM-tagged destination URL
Instead of linking to:
https://openqr.io/Link to:
https://openqr.io/?utm_source=table_tent&utm_medium=qr_code&utm_campaign=spring_menu_2026In OpenQR, paste this full UTM URL as the destination when creating or editing your QR code. The code itself stays clean and scannable – the UTM tags are invisible to the user and do not affect the pattern.
Set a consistent utm_medium=qr_code across every QR code you create. This lets you filter all QR traffic in a single GA4 segment instantly and see the combined picture of your entire QR program across all placements and campaigns. One filter reveals everything.
How to view your QR traffic in GA4
- In GA4, go to Reports, then Acquisition, then Traffic Acquisition
- Add a filter for Session medium equals
qr_code - You now see all QR-originated sessions with full behavioral data
- Break down by Session source to compare individual placements
5. Reading Your OpenQR Analytics Dashboard
OpenQR’s analytics dashboard updates in real time from the moment the first scan occurs – no setup, no waiting. Here is how to use each view effectively.
Overview panel
Total scans, and a trend line for each QR code in your account. Use this weekly to spot codes that have gone silent and identify which placements are actively performing.
Geographic map view
Scan density shown on an interactive map, drillable to city level. For multi-location businesses, this immediately shows which locations have the most active QR programs. For outdoor campaigns, it validates whether your placements are reaching the geography you intended.
Device breakdown
iOS vs Android split and browser type. Export this before any major campaign launch to confirm your destination is optimised for the dominant device your audience uses.
Time analysis
Hourly and daily scan heatmaps showing your peak engagement windows. Use this to time content updates and promotional changes for maximum impact – updating your menu before the dinner peak, scheduling a new landing page for the day your outdoor campaign reaches peak foot traffic.
Code comparison
Side-by-side scan performance across multiple codes. Essential for A/B testing and for comparing different placements in the same campaign.
Build a Monday morning dashboard review into your week. In 5 minutes you will know which codes are performing, which need attention, and whether any placement has gone dead. This one habit turns QR analytics from passive data into active campaign management.
6. A/B Testing QR Codes to Improve Performance
Because each dynamic QR code in OpenQR has independent analytics, A/B testing is straightforward. Create two codes with one variable changed, deploy them in comparable environments, and compare performance after a statistically meaningful period.
| Variable to test | Setup | What you learn |
|---|---|---|
| Call-to-action text | Code A: “Scan to view menu” vs Code B: “Scan to order” | Which CTA drives more scans from the same placement |
| Branded vs plain design | Code A: logo and colors vs Code B: black and white | Whether branding meaningfully increases scan rate |
| Placement location | Code A: table tent vs Code B: window sticker | Which physical location drives more scans in your venue |
| Destination page | Code A: PDF menu vs Code B: web menu | Which format produces better post-scan engagement in GA4 |
| Offer type | Code A: discount code vs Code B: free content download | Which offer incentivises more scans and conversions |
Change only one variable at a time. Run for at least two weeks. Use OpenQR’s code comparison view to evaluate scan rates, and GA4 to compare post-scan conversion rates if you are using UTM parameters.
The ROI of a QR code campaign doubles when you retarget users who have scanned on social media platforms – A/B testing gives you the data to identify which placement justifies that retargeting investment (Uniqode, 2026).
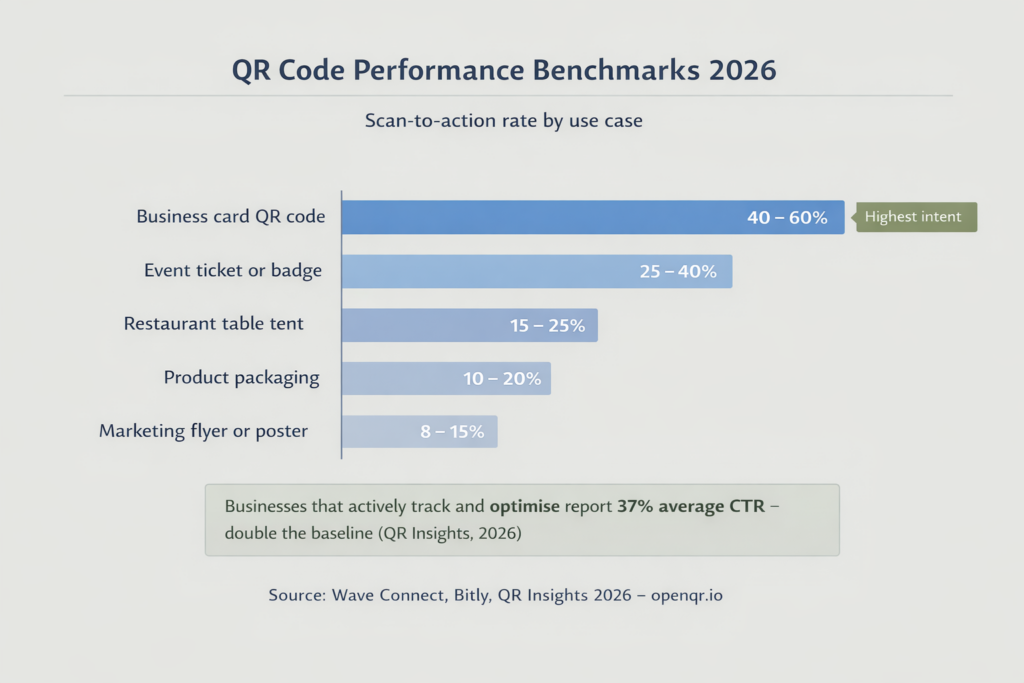
7. QR Code Performance Benchmarks for 2026
| Use case | Typical monthly scans | Good scan-to-action rate | Notes |
|---|---|---|---|
| Restaurant table tent | 200 to 800 | 15 to 25% | Peaks during dinner service 5pm to 9pm |
| Product packaging | 50 to 300 per SKU | 10 to 20% | Varies widely by category and scan incentive |
| Marketing flyer or poster | 20 to 150 | 8 to 15% | Highly dependent on foot traffic and CTA clarity |
| Business card | 5 to 50 | 40 to 60% | High intent – recipient chose to scan |
| Event ticket or lanyard | 300 to 2,000 per event | 25 to 40% | Spikes at event start |
| Window or entrance sticker | 100 to 500 | 12 to 20% | Captures walk-by and pre-visit traffic |
| Average across all use cases | varies | 15 to 20% | Wave Connect / Bitly, 2026 |
Businesses that actively measure and optimise their QR campaigns report 37% average CTR on QR-initiated journeys, more than double the 15 to 20% baseline average. The gap between average and excellent is not the code — it is the measurement, testing, and iteration that follows deployment.
8. Real-World Use Cases: What Good Analytics Look Like
The data-driven restaurant
A restaurant using QR codes for menus on table tents checks their OpenQR dashboard weekly and notices a consistent spike in scans between 6pm and 7:30pm every Friday. They use this to time their menu update cycle – new specials go live Thursday evening, ready for the peak window. They also see 78% of scans come from iOS, which informs their decision to prioritise Safari compatibility when redesigning their mobile menu page. One restaurant chain published a case study showing 43% higher average order value after implementing dynamic QR menus with conversion tracking (QR Insights, 2026).
The retail brand discovering new markets
A fashion boutique places unique QR codes on the price tags of high-value items. A particular designer dress shows over 400 scans in one month with low conversion. The location data reveals a cluster of scans from a city where the brand has no presence. Combined with the conversion gap, this tells two stories at once: high interest from a new market, and a product page that is not converting browsers into buyers. The analytics do not just show the problem – they show where to invest next.
The real estate agent finding hidden demand
An agent puts a QR code on a For Sale sign linking to a virtual tour and contact page. Analytics show that nearly 30% of all scans come from a zip code an hour away. This single data point drives a hyper-targeted Facebook campaign aimed at that specific area, shifting budget from local print ads that were producing no measurable response. A real estate team implementing this approach reported a 312% ROI increase from QR-driven lead capture on property listings (QR Insights, 2026).
The event organiser with real-time data
An event team uses QR codes on attendee badges and session handouts. During the event, they watch scan data in real time to monitor peak entry flow and identify which sessions are generating the most resource downloads. After the event, scan data by session becomes the primary input for planning the next event programme – based on what attendees actually engaged with, not what the organisers assumed they would.
9. How to Improve Scan Rates Using Your Data
Low total scans
Check placement data. Is the code in a visible location at the right moment in the customer journey? For restaurants, table tents account for 60% of all scans – if your code is on a receipt or counter card instead, move it. Adding a staff verbal prompt increases scan rates by 50% in hospitality settings.
High scans, low post-scan conversions (from GA4)
The code is working but the destination is not. Check GA4 bounce rate for your QR traffic segment. If it is above 70%, the landing page experience is failing. The most common cause is a destination page that is not mobile optimised. Every QR scan happens on a phone – if your destination requires pinching or horizontal scrolling, that is your problem.
Declining scan trend over time
The code has become physically invisible – worn off, covered, or contextually stale. Refresh the placement, update the CTA frame text, or change the destination to fresh content. Sometimes repositioning an existing table tent doubles scan rates without any other change.
Scans concentrated in unexpected locations
This is an opportunity, not a problem. Investigate whether you have organic placements in that region – packaging being sold there, a social share, a partnership. Consider whether to expand marketing to that geography intentionally.
Frequently Asked Questions
Can I track QR codes without a website?
Yes. OpenQR’s analytics dashboard captures all scan data regardless of whether your destination is a website, a hosted PDF, or a vCard. You do not need Google Analytics or any code on a website to access core QR scan metrics. A website is only needed if you want post-scan behavioral analytics via GA4.
What is the difference between total and unique scans?
Total scans counts every scan event, including multiple scans from the same device. Unique scans counts only distinct devices within a defined period. If one person scans your code three times, that is 3 total scans but 1 unique scan. For measuring audience reach, unique scans is more meaningful. The majority of marketers agree – 54% say unique scans is the most valuable QR metric (Bitly, 2026).
How accurate is QR code location tracking?
Location is derived from the scanning device’s IP address, which gives reliable country and region-level accuracy and good city-level accuracy in most cases. It is not GPS-precise. For venue-level granularity, use separate QR codes per location or per placement zone and compare their analytics individually.
Do QR code analytics work in real time?
Yes. OpenQR’s dashboard updates in near real time – scan data appears within seconds of a scan occurring. This is particularly useful for events where you can watch activity live as attendees arrive and interact with your codes.
Will adding UTM parameters affect the QR code pattern?
No. Because OpenQR’s dynamic QR codes encode a short redirect URL rather than your destination URL, the QR pattern is unaffected by any parameters you add to the destination. A destination with five UTM parameters produces exactly the same clean, scannable code as one with no parameters.
Can I export my QR code scan data?
Yes. OpenQR allows you to export scan data to CSV for further analysis in Excel, Google Sheets, or any BI tool. This is useful for building custom reports, combining QR data with other marketing sources, or sharing performance summaries with stakeholders.
Is QR code tracking GDPR compliant?
OpenQR does not store user IP addresses. All location data is aggregated and anonymised before being displayed in the dashboard. This makes OpenQR’s analytics fully compliant with GDPR and CCPA without requiring additional consent mechanisms for the scan tracking itself. If you connect to GA4 via UTM parameters, standard GA4 consent requirements apply for post-scan behavioral data.
Start Tracking Your QR Code Performance Today
Real-time analytics on every dynamic QR code from the first scan. Location, device, time, trends, and no scan limits. Free 14-day trial, no credit card required.